


Many annotation vendors can tell you how many tasks they completed. Far fewer can tell you whether your operations are becoming more efficient over time.
Most vendor conversations follow a familiar pattern. Pricing comes up. Turnaround times get discussed. Accuracy percentages appear in a slide deck. Completed task counts are presented as proof of capability.
All of these things matter. None of them tell you enough.
Outputs are lagging indicators. They describe what happened after the work was done. They don't explain how efficiently the system behind those outcomes is actually running, where the friction is quietly building, or whether your operations will hold together as volume increases.
Buyers who evaluate annotation vendors only on outputs often find themselves asking questions they can't answer once projects begin to scale: Why is QA effort increasing? Which datasets are creating the most delays? Are the workflows getting more efficient or just more expensive? Is throughput actually improving as the team grows?
These aren't edge-case questions. They're the questions that determine whether your annotation operations stay predictable and cost-controlled, or start to develop problems that only surface after significant time and money have been spent.
High-performing annotation operations aren't built solely on faster labeling. They're built on operational visibility too and visibility starts with knowing which metrics to look for in annotation service providers.
Why outputs are becoming an incomplete way to evaluate annotation outsourcing partners
Output metrics will always have a place in vendor evaluation. Accuracy matters. Throughput matters. Delivery time matters. The issue isn't that these metrics are wrong. The issue is that they're incomplete.
Outputs describe results. They don't describe the operational conditions that produced those results, or whether those conditions are sustainable as your data requirements grow.
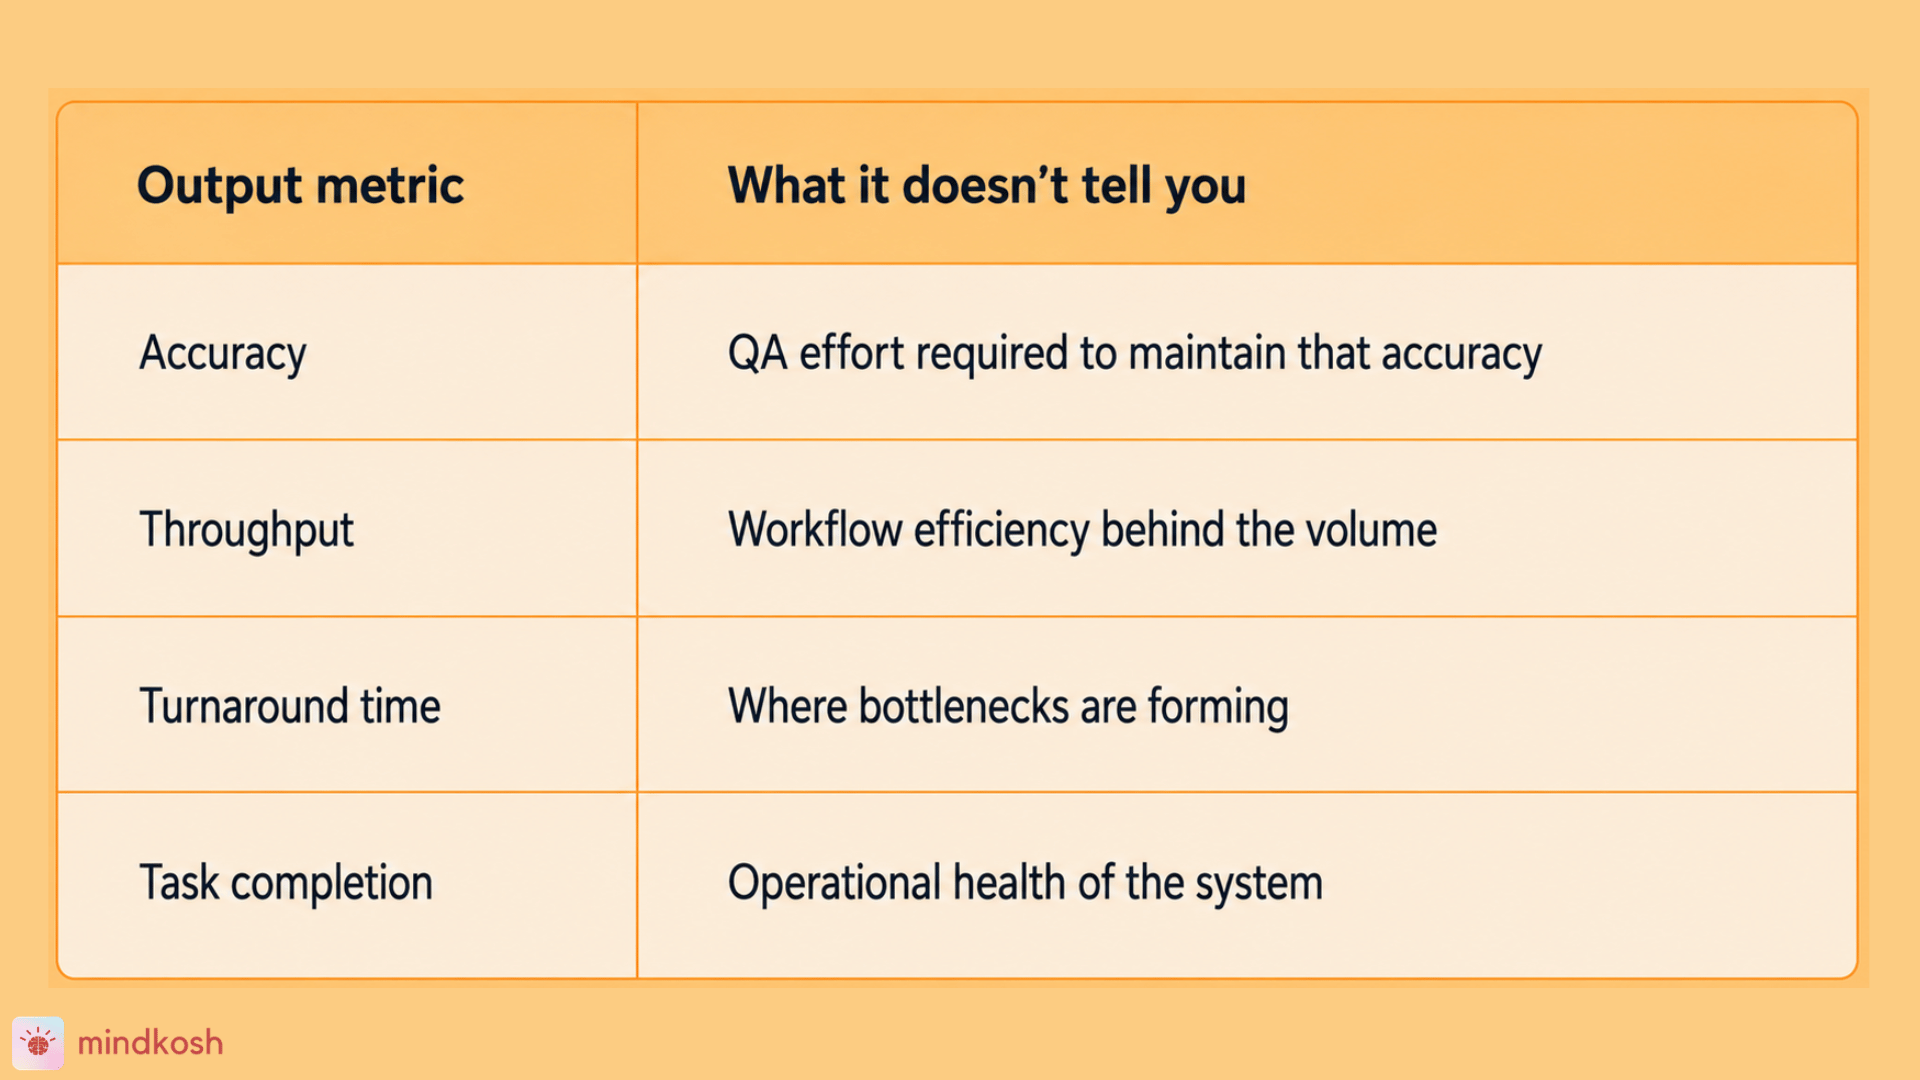
Accuracy percentages don't explain how quality is being maintained
An accuracy rate tells you whether labels met a threshold. It doesn't tell you how much reviewer effort was required to reach that threshold. It doesn't reveal how often reviewers disagreed with each other. It doesn't explain whether the QA process is becoming more labor-intensive with each dataset cycle.
A vendor delivering 96% accuracy on one dataset type might require four times the review effort to maintain that same rate on a more complex dataset. That difference doesn't show up in the output number. It shows up in your invoice.
Scaling operations creates complexity that output metrics can't capture
Output metrics are lagging indicators. By the time they reveal a problem, the operational damage has already happened and what looks like a scaling decision often turns out to be a compounding one.
Adding more annotators introduces communication overhead, coordination bottlenecks, and management burden on both sides that quietly erode efficiency long before any report flags it.
If operational visibility is missing, buyers are essentially managing a system they can't fully see. And an operation you can't see is one you can't improve.
Operational visibility gap that gets discovered too late
Annotation operations rarely become inefficient overnight. Problems tend to accumulate gradually, through reviewer bottlenecks that grow a little tighter each sprint, QA effort that increases slightly faster than throughput, communication friction that adds a few extra hours to every review cycle, and scaling decisions made without the data needed to make them well.
None of these problems announce themselves loudly. They compound quietly. And buyers working without operational visibility don't usually spot them until they've already affected delivery timelines, driven up costs, or forced reactive interventions that could have been avoided entirely.
The pattern is recognizable: teams end up diagnosing problems after the damage is already done, rather than having the visibility to prevent them. This is why operational visibility itself should become part of the buying criteria, not something you negotiate for after the contract starts.
The vendors worth partnering with are the ones who help surface operational signals proactively. The ones who don't are the ones who hand you a completed task report and ask you to infer the rest.
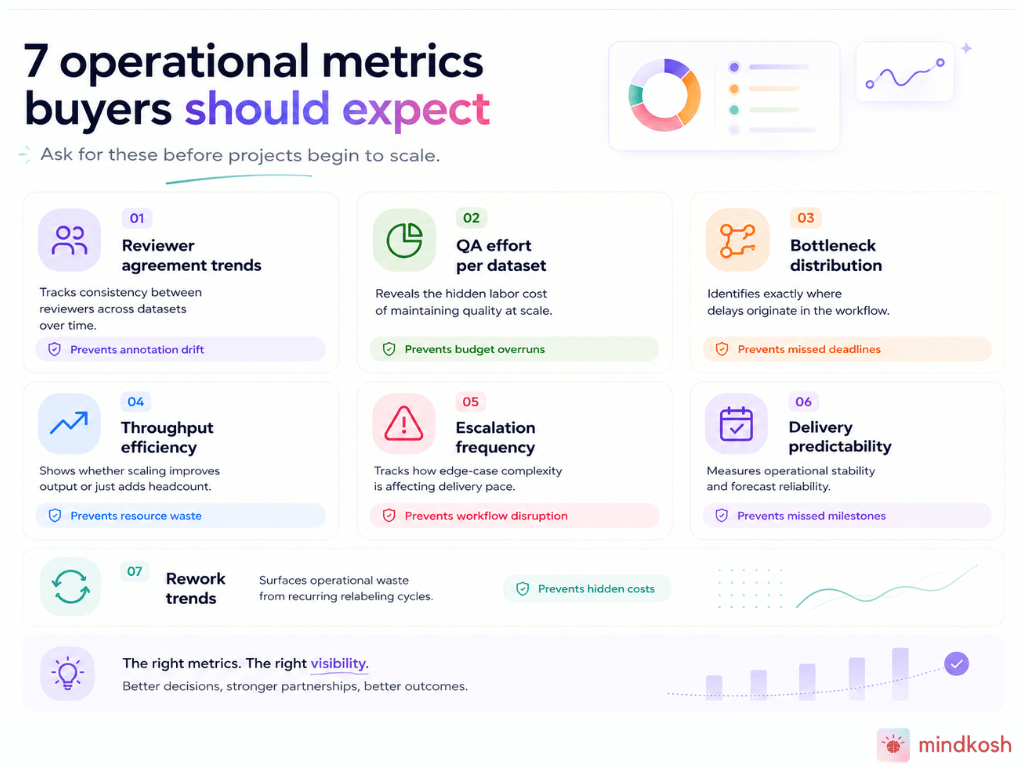
7 operational metrics buyers should expect annotation partners to help surface
These are not dashboards buyers should build themselves. These are metrics annotation partners should help buyers surface proactively, as a structural part of how the relationship operates.
1. Reviewer agreement trends
Reviewer agreement measures how consistently different reviewers label the same data. When agreement is high and stable, it signals that annotation guidelines are clear and the team is applying them consistently. When agreement starts to drift, it's an early signal of quality risk before that risk shows up in accuracy numbers.
Declining agreement often reflects unclear guidelines, reviewer fatigue, or dataset complexity that the current workflow isn't equipped to handle. Catching that trend early allows for course correction before you've accumulated a backlog of data that needs relabeling.
Key buyer question: Are disagreements between reviewers increasing as datasets become more complex?
Red flag: Teams constantly cycling back to relabel data that was already marked complete.
2. QA effort per dataset
This metric tracks the ratio of review effort to annotation volume across different dataset types. Some datasets require significantly more QA labor than others, and that difference has a direct impact on operational cost and scalability.
If QA effort is increasing faster than throughput, the operation is becoming less efficient even if output numbers look stable. The hidden labor cost of maintaining quality at scale is one of the most common sources of budget overruns in data annotation outsourcing services relationships, precisely because it's rarely tracked as a standalone metric.
Key buyer question: How much review effort is actually required to maintain quality across different dataset types?
Red flag: QA effort increasing faster than throughput, with no clear explanation for why.
3. Bottleneck distribution across workflows
Delays in annotation workflows almost always originate at specific, identifiable points, but without visibility into workflow stage data, buyers can only observe the end result: missed deadlines and compressed timelines.
Bottleneck distribution maps where time is actually being lost across the annotation lifecycle, whether that's in initial labeling, QA review, edge-case escalation, or export and integration. Knowing where friction lives consistently allows operations teams to redesign workflows or reallocate resources before problems compound.
Key buyer question: Which workflow stages repeatedly create friction, and is that friction being tracked over time?
Red flag: Bottlenecks only discovered after deadlines slip, rather than through proactive operational monitoring.
4. Throughput efficiency over time
Raw throughput numbers show how much work is being completed. Throughput efficiency shows whether the system is getting better at completing that work as it scales.
More annotators don't always mean better efficiency. If throughput efficiency is flat or declining while headcount increases, the operation is scaling cost without scaling performance. That's a structural problem that output metrics alone won't surface, because the total task count may still be going up.
Key buyer question: As the project scales, is the operation becoming more efficient or just more expensive?
Red flag: Headcount increasing while output efficiency remains flat or declines.
5. Escalation frequency and edge-case complexity
Escalations happen when annotators encounter data points that fall outside existing guidelines. Occasional escalations are normal. Escalation frequency that increases over time is a signal worth taking seriously.
Tracking escalation rates reveals how well the annotation ontology is holding up against real-world dataset complexity. It also signals whether the QA process is equipped to handle the variation your data actually contains. High escalation frequency often indicates ontology gaps that, if left unaddressed, will create persistent workflow disruptions and increase the cost of each annotation cycle.
Key buyer question: How frequently are edge cases requiring escalation, and is that frequency trending up?
Red flag: Constant reactive interventions with no systematic tracking of what's triggering them.
6. Delivery predictability
Delivery predictability measures how accurately a vendor can forecast timelines and then meet them. It's one of the most practical signals of operational maturity, and one of the most frequently overlooked in standard vendor evaluations.
A vendor who delivers on time on a small initial batch may not be able to maintain that predictability at ten times the volume. Tracking delivery accuracy over multiple project cycles reveals whether timelines are being met consistently or whether estimates are routinely adjusted after work begins.
Key buyer question: How accurately can delivery timelines be forecast, and how often do estimates change after projects start?
Red flag: Delivery dates that shift consistently after kickoff, without proactive communication about why.
7. Rework trends over time
Rework is one of the most direct measures of operational waste in annotation. Every relabeling cycle consumes time, labor, and budget that should have been spent on new data. When rework increases over time, it's a signal that something in the annotation process, whether that's guideline clarity, reviewer calibration, or workflow design, isn't working as it should.
Tracking rework trends over multiple project cycles surfaces patterns that batch-level output metrics miss. It also creates accountability: if rework is rising, the data exists to identify exactly where in the workflow it's originating.
Key buyer question: Is the volume of relabeling increasing as projects scale, and what's driving it?
Red flag: Recurring relabeling cycles treated as routine rather than as a signal worth investigating.
What collaborative annotation partnerships look like in practice
Operational visibility doesn't emerge from handing work off and waiting for results. It requires a different kind of vendor relationship, one where oversight, confidence, and active involvement remain with the buyer even as the execution work is outsourced.
The goal isn't to hand off work and lose visibility
Outsourcing data annotation should reduce operational burden. It shouldn't reduce operational control. The distinction matters, because teams that outsource without establishing visibility mechanisms often find themselves dependent on vendors for information they should be generating independently.
Buyers still need to know what's happening inside their annotation pipelines. They need the confidence that comes from being able to monitor progress, identify problems early, and make workflow adjustments without waiting for a project to conclude before any feedback is available.
Strong annotation partnerships create shared visibility
The most effective annotation partnerships function as shared operational systems rather than one-off labeling projects. The vendor isn't just completing tasks. They're helping the buyer understand performance trends, forecast operational risks, and improve workflows proactively.
That shift in relationship structure changes what buyers can expect from their data. Instead of receiving a completed batch and hoping the accuracy rate holds up at scale, they can monitor the operation in real time and course-correct before problems compound.
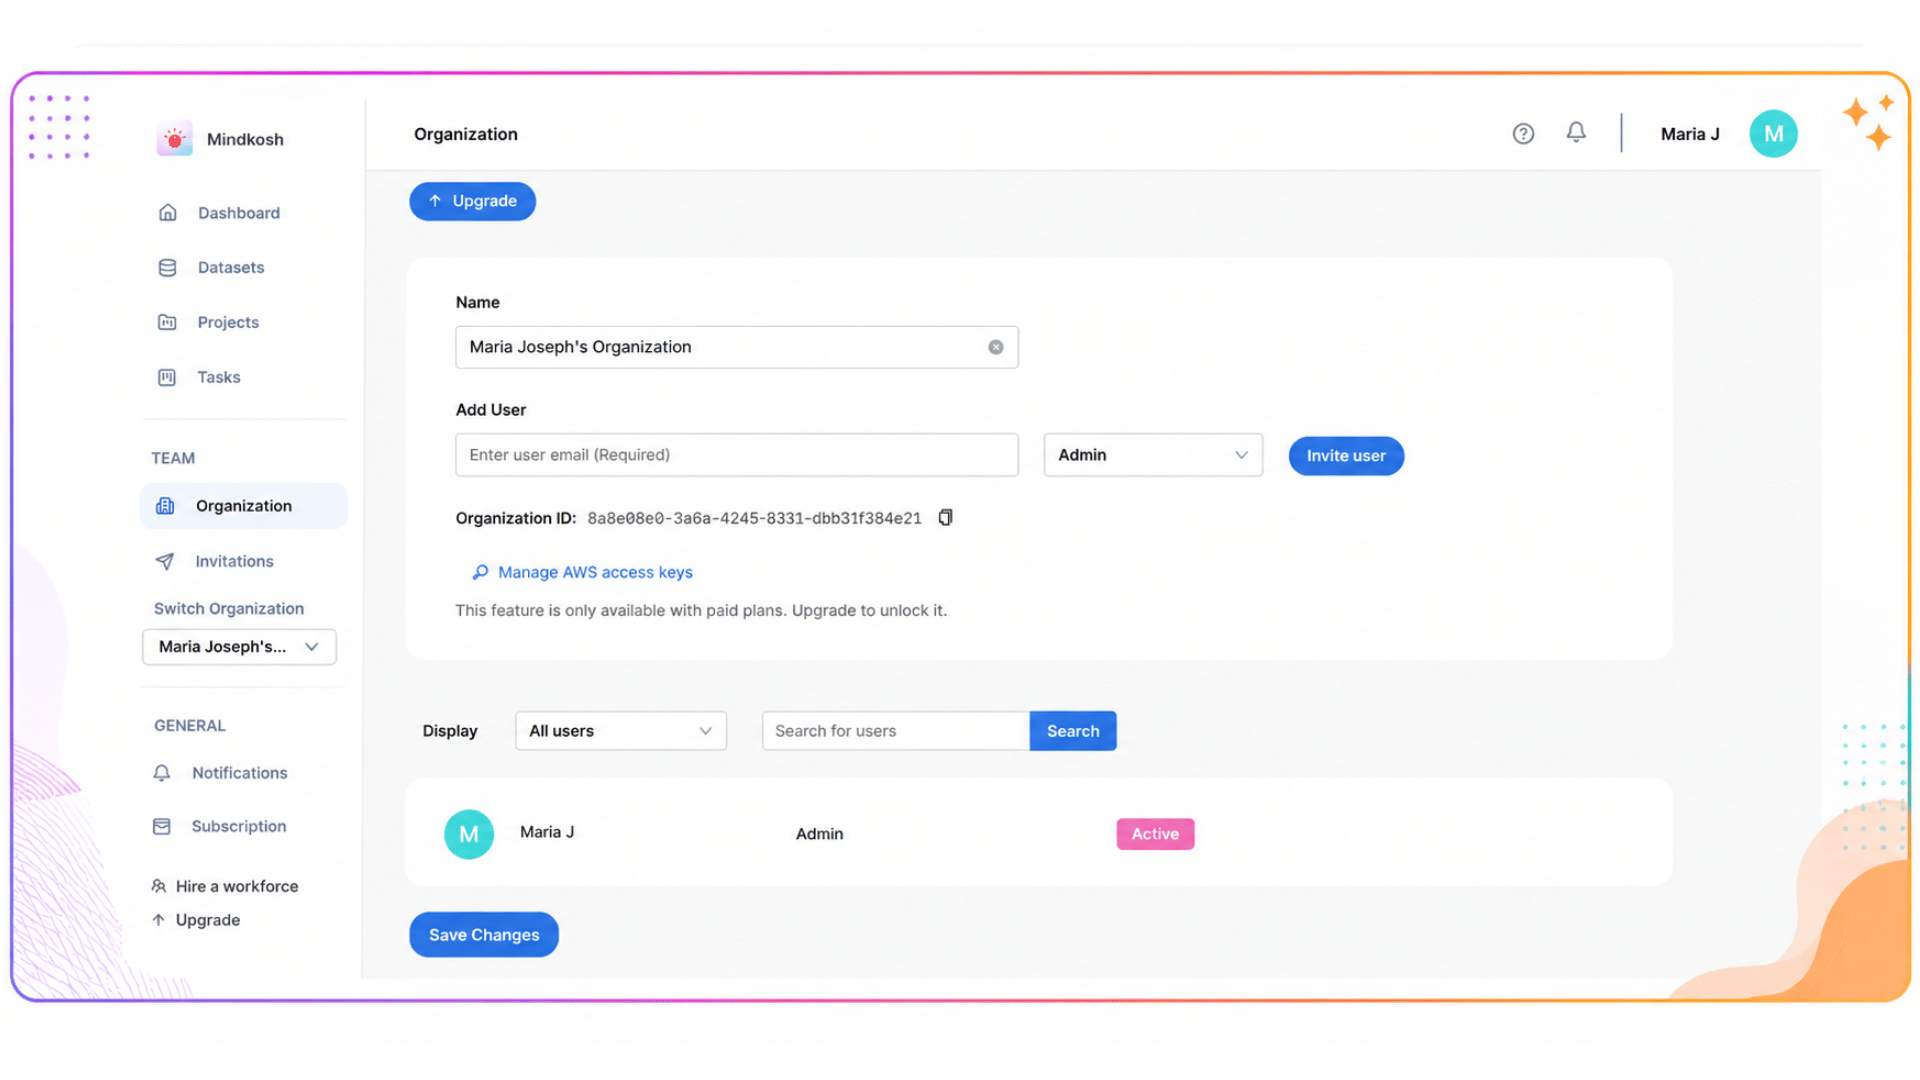
Mindkosh maintains operational visibility on managed service projects by building it directly into the platform that the annotation workforce uses. Clients access a self-serve dashboard that shows real-time progress across active batches, labeler productivity metrics, QA performance trends, and task-level accuracy data, all without waiting for a project to wrap before reviewing results.
If a client identifies an issue during active labeling, they can flag it directly inside the annotation canvas using a built-in issue management system, which opens an immediate resolution channel with the service team. Dedicated channels connect client stakeholders with service managers, so communication is tied directly to platform activity rather than running in parallel to it.
Data security is built into the same visibility framework. Clients can connect their own AWS S3 accounts so that data is streamed directly to the browser and never routed through external servers unless explicitly chosen. Role-based access controls ensure that each user, whether an admin, project manager, or annotator, sees only the data relevant to their function.
The result is a managed service model where the buyer retains full operational awareness without needing to manage the day-to-day execution themselves.
How to evaluate data annotation outsourcing services beyond outputs
Bringing operational visibility into your buying criteria isn't complicated. It requires adding a different category of questions to vendor conversations and evaluating answers with the same rigor applied to pricing, accuracy, and turnaround time.
Add operational visibility to your vendor evaluation criteria
Evaluate providers across four categories, not three. Most vendor assessments cover pricing, quality credentials, and technical capabilities. Add operational visibility as a fourth category, and weight it accordingly.
Within that category, evaluate vendors on whether they track the seven metrics described above, how frequently they surface that data to clients, whether clients can access it independently or only through vendor-prepared reports, and what happens when operational problems are identified during an active project.
The answers to those questions reveal a great deal about how a vendor actually operates, not just what they're capable of delivering.
Ask what systems exist, not just what outputs will be delivered
The most important shift in vendor evaluation is moving from asking "what can this vendor deliver?" to asking "what visibility will this vendor give us once projects begin to scale?"
A vendor who can describe their operational systems in detail, who can explain how they track reviewer agreement, how they manage escalations, and how they surface bottlenecks before they affect delivery, is demonstrating something that output metrics alone cannot: a systems-thinking approach to annotation operations.
That's the vendor worth building a long-term data annotation outsourcing services relationship with. Not because the output metrics look best in isolation, but because the operational infrastructure supporting those outputs is visible, trackable, and designed to improve over time.
Conclusion
The best annotation vendors don't just report outputs. They provide the visibility teams need to control quality, forecast budgets, improve workflows, and scale with confidence.
Because the goal of outsourcing annotation work isn't simply to get tasks completed. It's to build annotation operations that remain visible, manageable, and predictable as they grow. Output metrics can tell you whether a vendor delivered. Operational metrics tell you whether that delivery is sustainable.
Mindkosh helps teams outsource annotation work without outsourcing operational visibility.
Before your next vendor conversation, add the operational visibility question to the list. Ask what gets tracked. Ask how it surfaces. Ask what happens when something starts trending in the wrong direction. The answers will tell you more about a vendor's long-term reliability than any accuracy rate or turnaround time estimate ever could.
Frequently asked questions
What are operational metrics in data annotation outsourcing services?
Operational metrics track the efficiency, predictability, and health of annotation workflows, not just the final outputs. They include signals like reviewer agreement trends, QA effort per dataset, bottleneck distribution, and rework frequency. Unlike output metrics such as accuracy or task completion, operational metrics reveal whether the system producing those outputs is running efficiently and whether it will continue to do so as volume scales.
What should buyers ask annotation vendors about operational visibility?
Ask which of the seven operational metrics they track systematically: reviewer agreement trends, QA effort per dataset, bottleneck distribution, throughput efficiency, escalation frequency, delivery predictability, and rework trends. Then ask how that data is surfaced to clients, how frequently it's shared, and what the process is for addressing operational issues identified during active projects.
How is operational visibility different from project reporting?
Project reporting typically delivers a summary of outputs after work is completed. Operational visibility provides real-time or near-real-time access to workflow performance data during active projects. The difference is the ability to identify and address problems as they develop, rather than discovering them after a batch is delivered or a deadline slips.
Does outsourcing data annotation mean losing operational control?
It doesn't have to. Well-structured annotation partnerships are designed so that outsourcing reduces operational burden without reducing operational control. The buyer retains visibility into workflows, quality metrics, and delivery performance even as the execution is managed externally. Vendors who provide platform-level access to operational data, rather than just reporting summaries, make this possible.
What is the difference between a transactional annotation vendor and a long-term annotation partner?
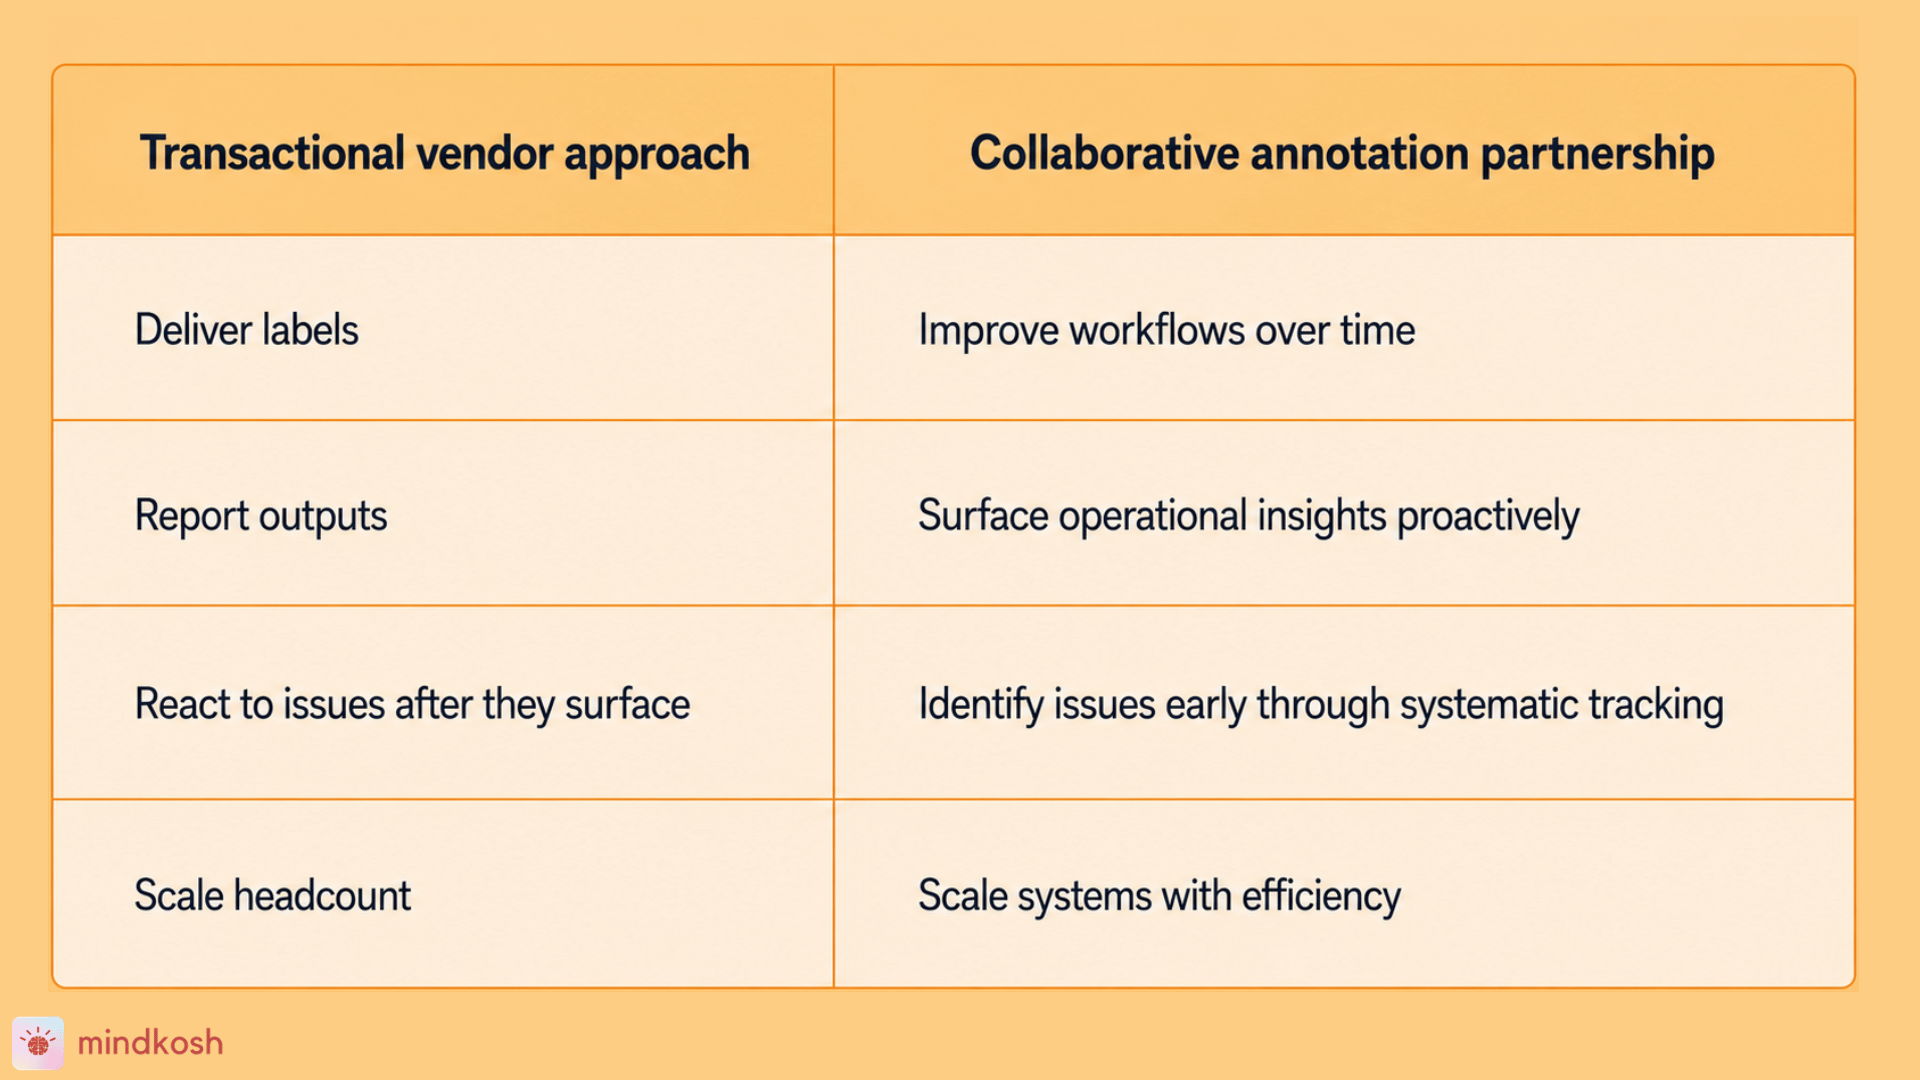
A transactional vendor delivers labels and reports outputs. A long-term annotation partner surfaces operational insights, helps forecast risks, and works with buyers to improve workflows over time. The structural difference is shared visibility: partners treat annotation operations as a system to be managed collaboratively, not as a project to be handed off and completed.
See what operational visibility looks like in practice
Mindkosh combines expert annotation services with a self-serve platform that keeps clients in full view of their workflows, from task-level progress tracking to real-time QA dashboards, without waiting until a project is complete to surface what's happening inside it.
Talk to the Mindkosh team about how operational visibility can become part of your annotation program from day one.
Get in touch with us today